User Guide
Audience: whoever uses the Orpheus dashboard to explore what the sensors have observed — the birds, crows, other sounds, and correlated animal "entities" around the site.
If you run or deploy Orpheus (install, config, health, troubleshooting), you want the Operator's Manual instead. If it isn't installed yet, start with installing it — or have an AI assistant do it.
On this page: what each dashboard page shows, how to filter and play back what was heard, how to review the equivalences Orpheus proposes, and what the diagnostics tell you. New in this release: see What's new.
For the architecture and setup of the UI service itself, see Orpheus UI.
The dashboard at a glance
Orpheus classifies the soundscape (and video motion) and correlates detections from different classifiers into single entities. The dashboard is organized by what produced the data:
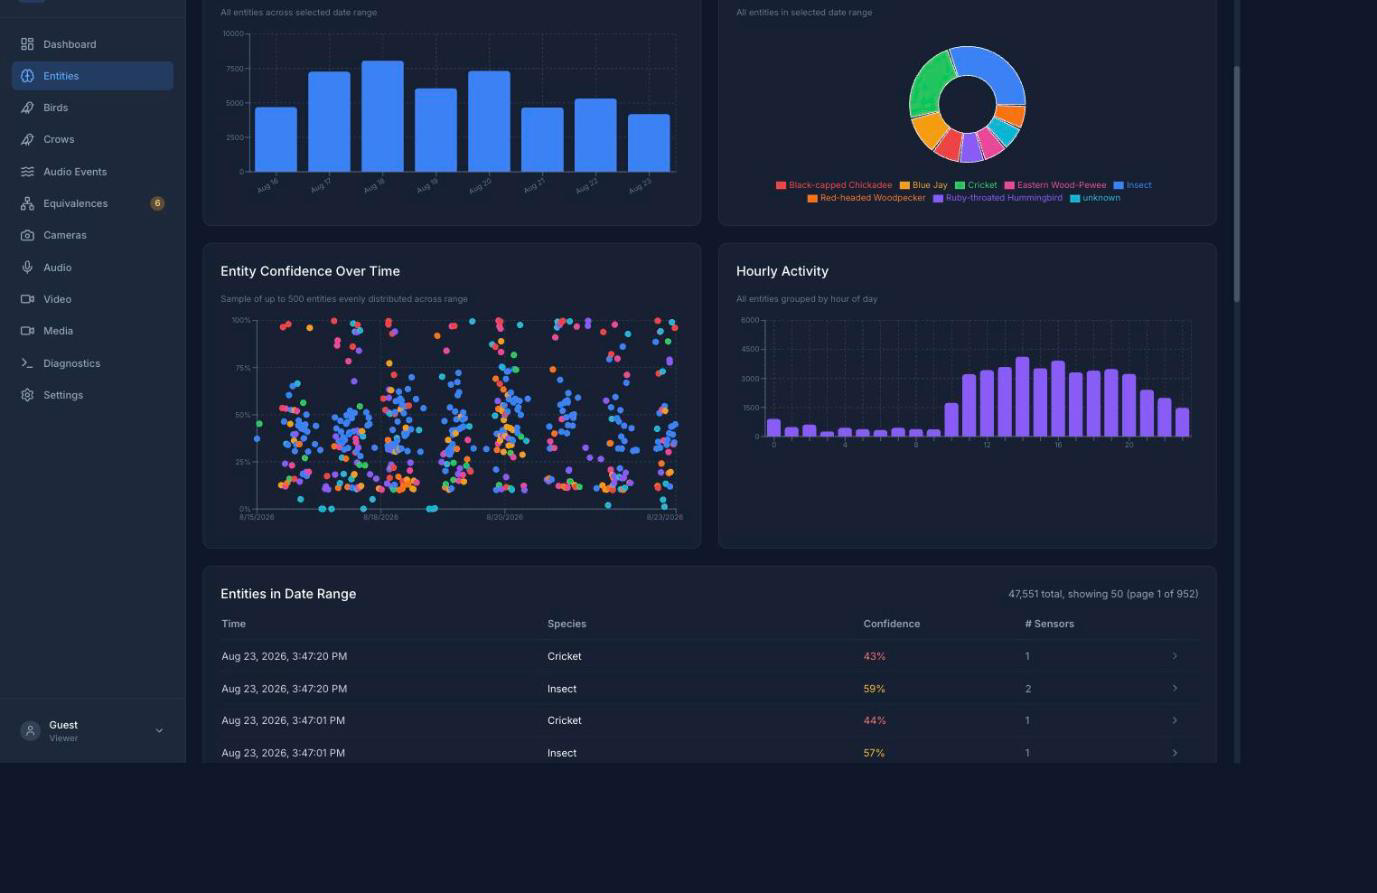
Eight days on a real deployment — 47,551 entities.
- Birds — species detections (BirdNET). Browse, filter, and play back the audio clip that triggered each detection.
- Crows — the corvid-specialist channel (call type / context).
- Audio Events — non-bird sounds (PANNs / AudioSet): dogs, vehicles, speech, sirens, and the rest of the soundscape, each labelled by type.
- Entities — the correlator's fused view: one entity per real-world animal/event,
built from the evidence of several classifiers (e.g. a crow seen by BirdNET +
crow-tools + audio-events collapses into one entity). Each entity shows a small
type chip (a dotted path like
Animal.Bird.Crow), and sounds Orpheus itself played back carry a self-generated tag so you don't count them as wildlife (when your operator has turned on corollary discharge —corollary_discharge.enabled). - Diagnostics — system health: correlator health, storage trend, recent errors, agent presence, audio system health, and a service log viewer.
- Dashboard — the landing page: machine vitals, disk usage, per-service status, and whether audio and video capture are currently running. The Bird Detection and Camera Feeds tiles beside them are placeholders that always read "Active" — use the per-service status list to tell whether those are alive.
- Equivalences — the identities Orpheus proposes when two classifiers appear to be naming the same animal, and the accept/reject queue for the ones it will not decide on its own. See Equivalences below.
- Cameras, Audio, Video — the live views of what each sensor is doing right now: camera snapshots and stream state, input levels per audio channel, and recent video motion.
- Media — snapshots and timelapses to browse and download after the fact. Recorded audio and video clips are not here; you reach those from the detection rows on the Birds, Crows, Audio Events, Entities, and Video pages.
- Settings — your account, and, signed in as an admin, the served configuration as
the dashboard sees it. Signed in as a viewer the configuration block reads
"Configuration unavailable". Everything here is read-only; configuration changes are
made in
orpheus.yamlon the host, and the Security, Notifications, Data Management and System cards are placeholders that do nothing yet.
Filtering the data pages
Birds, Crows, Audio Events, and Entities share the same filter controls:
- Date range — bound the time window; a small spinner shows when a filter change is refetching.
- Species / Labels — pick one or more species (Birds/Crows) or sound labels (Audio Events).
- Time-of-day window — narrow to e.g. dawn or night.
Results paginate; the stat cards and charts (counts, unique species/labels, distribution) reflect the current filter — with two exceptions on the Crows page, where "Call Types by Time of Day" and "Age Groups by Time of Day" are built from the 50 rows on screen rather than the whole range, so they change as you page.
Playing back a clip
Each detection row links to the audio (or video) clip that triggered it. If a clip has rolled off retention (the database keeps a detection longer than its media), the player shows a "clip expired" state instead of erroring — the detection record remains, only the media is gone.
Equivalences: teaching Orpheus that two labels mean one animal
Different classifiers name the same animal differently. BirdNET may report American Crow while the general sound model reports Crow from its own vocabulary — one bird, two labels. An equivalence records that those two labels mean the same thing, so the correlator fuses them into a single entity instead of listing them twice.
Orpheus proposes equivalences on its own. A background scan looks at which labels keep showing up together in the same moment; pairs that co-occur overwhelmingly are accepted automatically, and the merely-plausible ones wait for you.
The Equivalences page is where you settle those. It shows:
- Pending review — proposed pairs, each with how often the two labels were seen together. Accept makes the pairing live immediately; Reject records that they are genuinely different and stops it being proposed again.
- Accepted — pairings currently in force, including the ones accepted automatically.
- Last scan — when the discovery run last completed, or a note that it has not run yet.
You do not have to do anything here for Orpheus to work — an unreviewed proposal simply isn't applied. Reviewing them makes the Entities page tidier over time.
External species links
Bird/entity detail views link the species out to external references (iNaturalist, Wikipedia, GBIF; AudioSet for audio-event labels), preferring the scientific name so the link lands on the right taxon.
Weather
The Dashboard has a compact Weather card that shows the current temperature, humidity, and wind speed, plus the timestamp of the reading. It appears only when a station is reporting.
Weather ingestion is stubbed: the card, the storage, and the ingestor are written, but the Ecowitt field mapping is not, so no reading reaches the card on any installation today. You will not see this card until that lands.
Diagnostics page
Shows live system health without you having to log into the box: correlator health (including how long a detection chain takes to complete), a storage trend with a projection of when each volume fills, a per-category storage breakdown, a cross-agent recent-errors feed, agent presence, audio system health with per-channel levels, and a service log viewer. The audio-events model's p50/p95 latency is on the Audio Events page, and the most recent auto-discovery scan is on Equivalences. (How that health is sourced + monitored is in the Operator's Manual.)
Storage headroom
A Storage headroom panel breaks the disk down by what is on it — audio clips, motion video, snapshots, timelapses, and the detections database — and shows how much each one is using.
Underneath each figure it tells you what, if anything, trims that category. The four recording categories each have a size ceiling, so they show a bar with a mark where trimming begins, how many days of recent recording is protected from deletion whatever happens, and a note about what the last pass removed and which dates it took. The detections database says Nothing cleans this up — it grows until you do something about it, which is worth knowing before the disk fills rather than after. If a category is over its ceiling but everything it still holds is inside its protected window, the panel says so in amber rather than leaving you to wonder why a full bar is not going down.
At the bottom is the free-space reserve: how much free space is left, and the threshold below which every category above its protected window starts giving up its oldest recordings, in proportion to how much each has to give. If free space is under the reserve and every category is down to its protected window, the panel says that too, in red — that is the one situation where nothing more can be deleted automatically and someone has to intervene.
The figures come from orpheus-storage-sweep, the one component that deletes
recordings, rather than being measured when you open the page. It runs every 15
minutes, and the panel says how long ago it last measured. In the first day after
an install the panel notes that the sweep is reporting only and has deleted
nothing yet; if the sweep has been turned off, or has never run, it says that
instead of quietly showing stale numbers. A station whose sweep has never run says
not yet measured rather than showing zero.
To change any of this, see Data & retention in the Operator's Manual.
Agent presence
An Agent presence panel lists the agents that are online right now: each live agent announces itself continuously, and one that dies drops off the list within a minute or two.
This needs presence turned on (event_bus.presence_enabled — see the
Operator's Manual).
Without it the panel shows a muted "Presence not available on this backend/config"
note and everything else on the page works normally.
Changing the dashboard
If you are adding or changing a dashboard feature, update this guide in the same change — a feature is not done until its documentation lands with it. Add a subsection under the matching heading above (or a new heading for a new page), describing what the user sees and does — not the implementation, and plain enough for a non-engineer running their own wildlife box. Operator-facing changes belong in the Operator's Manual instead; some changes touch both. See Contributing.